Effects of a double mutation on the structure and stability of the S. aureus KPR dimer
by Bita Jadali
Ketopantoate reductase (KPR) is a catalytic enzyme that reduces ketopantoate to pantoate which is later converted into coenzyme A (CoA).1 CoA is a necessary substrate in energy production and metabolism, and the disruption of KPR can disrupt energy production in bacteria, which is why it stands as a promising drug target for future antibacterial treatment.1 The KPR of S. aureus exists as a dimer and depends on this structure to function properly.1 We explored the effects of mutations to the amino acids that form the structure of the interface between the monomers of KPR that form the dimer. Using side-directed mutagenesis with PCR, we mutated glutamate 194 (Glu 194) to arginine (Arg) in a S. aureus KPR plasmid already carrying the phenylalanine 279 (Phe 279) to Arg mutation in order to study the effects of both mutations on the KPR dimer structure and therefore the overall stability of the S. aureus KPR protein. Preliminary results of our Glu 194 to Arg mutagenic PCR and protein gel of our purified KPR protein are presented along with our future plans to verify mutagenesis with restriction digest and performing further structural assays, such as native-PAGE, to assess the effects of a double mutation at Phe 279 to Arg and Glu 194 to Arg on KPR structure and dimerization integrity.
ketopantoate reductase (KPR), Staphylococcus aureus (S. aureus), mutagenic PCR,
site-directed mutagenesis
Introduction
Staphylococcus aureus (S. aureus) commonly exists on healthy human skin without any dire consequences, but it can still cause severe infections if it does enter the body through open skin.1 If bacterial infections do occur, antibiotics are most often used to treat them, but due to the emergence of antibiotics resistance in S. aureus, such treatment options can be limited in their efficacy, therefore raising the need for better treatment options.1 New discoveries in drug treatment, however, aim to target the pantothenic biosynthesis pathway to inhibit Coenzyme (CoA) production to get around such antibiotic-resistance.2
In both bacterial and mammalian organisms, CoA is essential in metabolism, such as for the production of acetyl CoA.3 Like most bacteria, S. aureus relies on oxidative phosphorylation for energy production, a function that requires acetyl CoA. CoA is made from pantothenic acid which is made from pantoate which is made from ketopantoate.4
Ketopantoate reductase (KPR) is the catalytic enzyme in many bacteria (e.g., Escherichia coli and S. aureus)that facilitates the reduction of ketopantoate to pantoate, using reduced nicotinamide adenine dinucleotide phosphate (NADPH) as a cofactor that acts as the reducing agent.3,5 The mechanism involving the active site of KPR working with NADPH is dependent on the KPR structure, which varies among different bacteria. E. coli KPR, for example, exists as a monomer whose active site residues include lysine 176 and glutamate 256, which, upon site-directed mutation to arginine (Arg), showed lower kinetic activity, demonstrating that structural changes of the KPR active site results in decreased functioning of the KPR enzyme.6,7
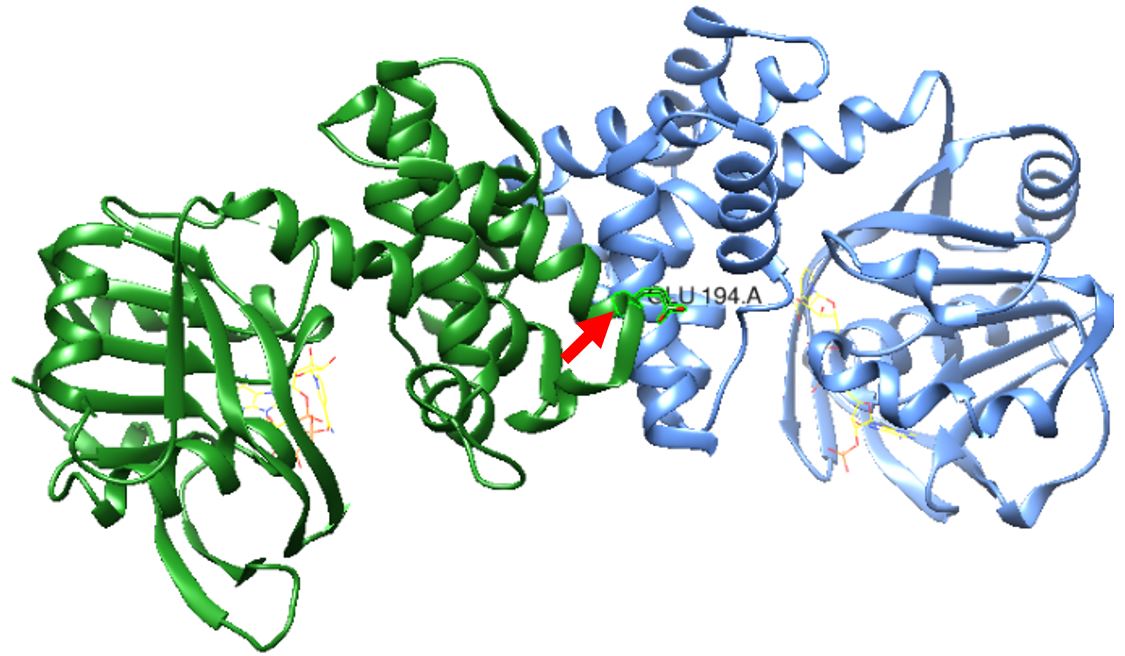
Figure 1: S. aureus KPR dimer complexed with NADPH as shown in yellow wire structure. Glutamate 194 is labeled in the middle near the active site, as pointed to by the red arrow. Taken from UCSF CHIMERA®.
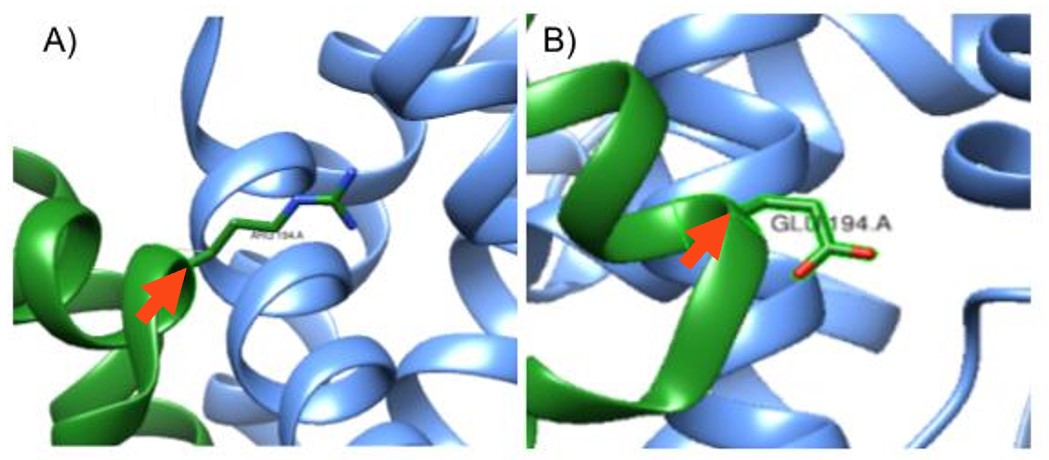
Figure 2: Mutation at the 194th amino acid on the A chain. A) In-silico mutation of S. aureus KPR of Glutamate 194 to Arginine, pointed to by the red arrow. B) S. aureus KPR with its wildtype Glutamate amino acid at the 194th amino acid in sequence, pointed to by the red arrow. Taken from UCSF CHIMERA®.
While the structure of KPR is well studied in E. coli, the KPR structure is less studied in S. aureus. In S. aureus, KPR functions as a dimer with an interface between the two monomers, and the interface residues include glutamate 194 (Glu 194), which keeps the two polypeptide chains together, and phenylalanine 279 (Phe 279).5 Looking at this dimer interface, previous mutations of either Glu 194 to Arg or Phe 279 to Arg in our lab have shown to create instability and aggregation of the KPR mutant protein. With our current research, we want to further investigate the functioning and kinetic activity of S. aureus KPR by studying the effects of simultaneous Glu 194 to Arg and Phe 279 to Arg mutations on the stability of the KPR dimer structure. We predict that since Glu 194 and Phe 279 are both key amino acids at the S. aureus KPR dimer interface, mutations in such locations will disrupt the S. aureus KPR dimer stability.
Knowing how to disrupt the activity of the S. aureus KPR enzyme proves to be a very promising drug target as inhibition of its function can disrupt energy metabolism which can cause cell death. Similar antibiotics which inhibit the CoA pathway have already been developed for other bacteria, such as for mycobacterium tuberculosis and E. coli.8,9 Antibiotics for S. aureus which target the CoA pathway have been developed, such as CJ-15 801, which inhibits CoA production by imitating pantothenic acid, the immediate precursor to CoA.2 Using the same process, similar antibiotics that target the CoA pathway further upstream by inhibiting or disrupting KPR activity can be developed to treat S. aureus infections.
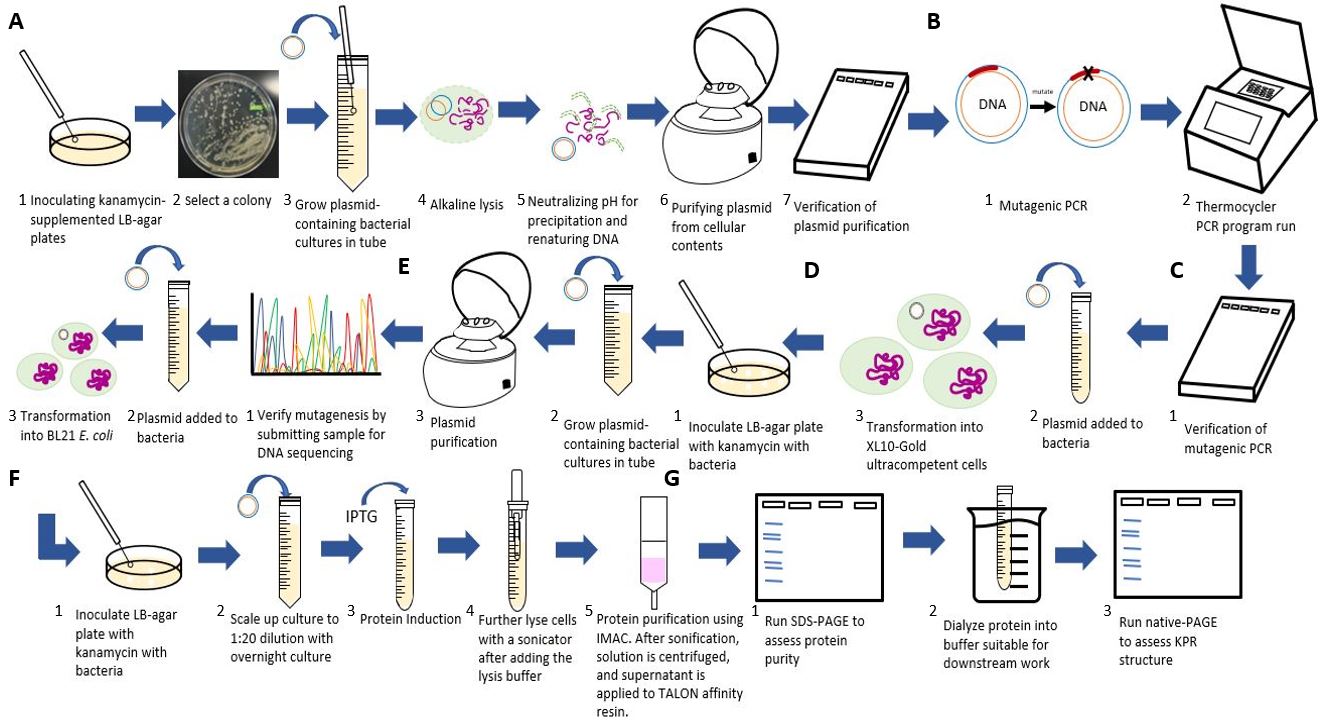
Figure 3: Flowchart of our experimental procedures. A) Steps for purifying the S. aureus KPR plasmid. B) Steps for the inserting the Glu 194 to Arg mutation using PCR. C) Steps for transforming and verifying the mutagenesis. D) Steps for purifying and inoculating the mutated plasmid. E) Steps for transforming the mutated plasmid. F) Steps for scaling up and inducting protein production from the mutated plasmid. G) Steps for running an analysis on our mutated S. aureus KPR
Methods
Structural Analysis
Using UCSF Chimera®, as shown in Figure 1, we studied the protein structure of S. aureus KPR to identify the structural changes in the protein after a Glu 194 to Arg mutation, shown in Figure 2B.
Plasmid Purification and Verification
As shown in Figure 3A, we inoculated LB-agar plates supplemented with 50 ug/mL kanamycin with E. coli glycerol stock containing the S. aureus KPR 6182-bp plasmid that contains the kanamycin resistance gene and then were incubated at 37 oC. The plasmid containing the S. aureus KPR gene was kindly gifted to us by Dr. Zachary Wood, Professor in the Department of Biochemistry and Molecular Biology at the University of Georgia. We then did resuspension of the cells, alkaline lysis, neutralization of pH for DNA precipitation and renaturing, and purification of plasmids from cellular contents.
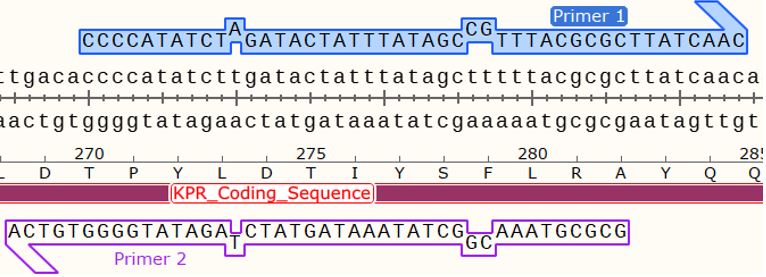
Figure 4: Mapping of the hybridization of the forward and reverse primers for a Phe 279 Arg mutation onto the S. aureus KPR plasmid sequence, showing an insertion at two points of the wildtype KPR sequence. Taken from SnapGene®.
In order to verify plasmid purity after the purification step and to obtain a rough estimate of the DNA concentration, we prepared a 1% agarose gel electrophoresis to which 0.2 ug/ml ethidium bromide was added for visualization of the DNA under UV light, and which was run with samples of varying concentrations of KPR plasmid DNA. We obtained UV imaging of the gel, and we ran UV-vis spectrometry to obtain a more exact estimate of the DNA concentration to be used when performing the mutagenic PCR.
Mutagenic PCR and Verification I
In order to induce a double mutation, we first performed a Phe 279 to Arg mutagenic PCR on wildtype S. aureus KPR plasmids, which we purified from initial E. coli glycerol stock, as demonstrated in Figure 3B. The mutated plasmids then were transformed into BL21 ultracompetent cells to promote KPR protein production which we then purified to use to assess the stability of the protein with respect to its structure after the double mutations, as illustrated in Figure 3C.
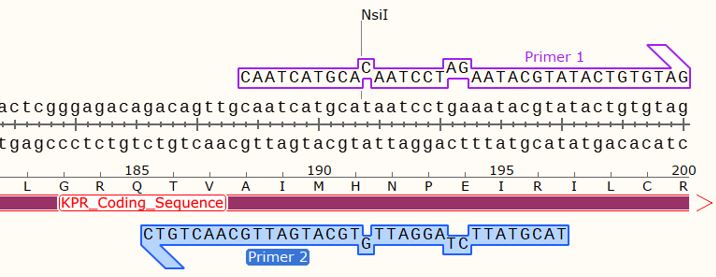
Figure 5: Mapping of the hybridization of the forward and reverse primers for a Glu 194 Arg mutation, onto the S. aureus KPR plasmid sequence, showing an insertion at two points of the wildtype KPR sequence. Taken from SnapGene®.
To induce the Phe 279 to Arg mutation we used the SDM-assist® software to narrow down our chosen primers for the mutagenic PCR as well as the SnapGene® program to help predict the binding of the primers. As seen in Figure 4, we used the forward primer and reverse primer, which contain a missense insertion of GC which changes Phe 279 to Arg, as well as a silent insertion of T to create a XbaI restriction site at 5900 bp. By comparing the agarose gel electrophoresis banding patterns of the mutated and wildtype KPR plasmids after a restriction digest of XbaI, if our mutated KPR plasmids contains two distinct bands, that would verify our Phe 279 to Arg mutagenic PCR was successful.
Mutagenic PCR and Verification II
Structural Analysis and Primer Design
As shown in Figure 1, we used Sanchez et al. (2015) to replicate the S. aureus KPR, with the Glu 194 labeled on the A chain (PDB code 4YCA). We then mutated Glu 194, a negatively charged amino acid, to Arg, a positively charged amino acid, as shown in Figure 2.
Using SDM-assist®, we were able to design the primers for completing a mutagenic PCR of Glu 194 to Arg on S. aureus KPR plasmids. We first selected the sequence for our glutamate 194 to arginine mutagenesis, which also consisted of a removal of NsiI restriction site. For the primers, we chose the forward primer and reverse, which we had previously shown to induce the Glu 194 to Arg mutation, as shown in Figure 5 and 6.
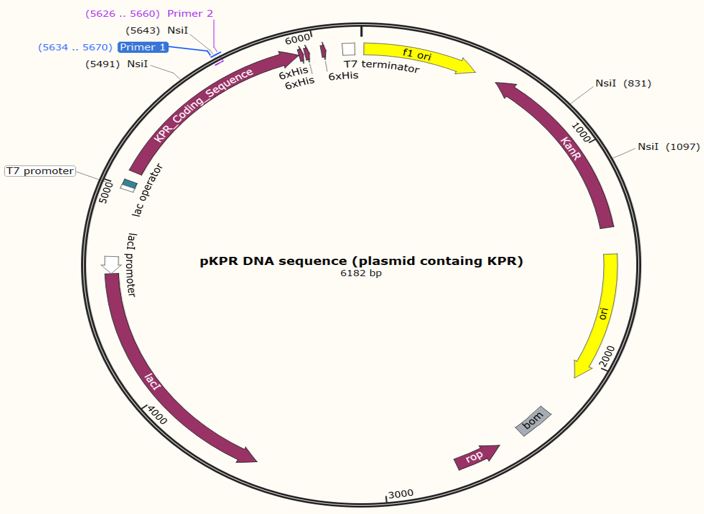
Figure 6: Map of the KPR plasmid for a Glu 194 to Arg mutation with the forward primer shown at primer 1 and reverse primer at primer 2. NsiI restriction sites are shown at 831 bp, 1097 bp, 5491 bp, and 5643 bp. Taken from SnapGene®.
Mutagenic PCR and Verification
We carried out a mutagenic PCR reaction for the KPR plasmid, using the primer mix that includes our chosen forward and reverse primers. To verify the mutagenic PCR, we prepared a 1% agarose gel electrophoresis set-up like for the plasmid purification verification to verify the presence of the KPR 6182-bp plasmid in the PCR product for confirmation of the success of the mutagenic PCR.
Transformation of Plasmids into Ultracompetent E. coli
We transformed the KPR plasmids that underwent mutagenic PCR into XL10-gold ultracompetent cells using heat-shock. Afterward, we cultured the cells onto kanamycin-supplemented LB-agar plates overnight.
As shown in Figure 3D and 3E, after culturing plasmid colonies, we purified the plasmids from our chosen colonies. We then verified to see if the colonies with the desired mutated plasmids had successfully been transformed into the E. coli cells by preforming a restriction enzyme digest using NsiI (Thermo Scientific Cat # ER0731) to verify the success of a Glu 194 to Arg mutation, as well as sending samples to “GeneWiz” for DNA Sanger sequencing, which uses the T7 Universal Primer to analyze if the mutation has been incorporated into the KPR plasmid DNA.10
Transformation of Plasmids into BL21(DE3) E. coli
After verification, we transformed the KPR plasmids with the double mutation into competent BL21 (DE3) E. coli cells. We then scaled up the overnight culture by performing a 1:20 dilution.
Protein Expression and Purification
We let the BL21 E. coli cells replicate in a shaking incubator until the Optical Density read around 1.0-1.3, after which we induced protein production before incubating in a shaking incubator. Then, as illustrated in Figure 3F, we purified the protein using his-tag purification, in which after harvesting the cells by centrifugation, the cells were resuspended with lysis buffer and then further lysed through sonication. Then, the lysed cells were centrifuged before the supernatant was added to a disposable gravity column with anti-histidine TALON affinity resin, which binds to the his-tag proteins in our plasmid. With washing buffer, we washed the column and then eluted with elution buffer containing a high concentration imidazole that loosens the bound plasmids from the resin. We collected 1 mL samples of flow-through before washing, at the start and end of washing, and three times from the start of elution.
We assesed protein purity of the fractions with a protein gel and corresponding staining dye to visualize the banding of the linearized proteins in the fraction, as shown in Figure 3G, to assess the mutated protein’s mass. The rest of the protein sample underwent dialysis, after which we analyzed the protein with another protein gel to examine both the mass and 3D structure of the S. aureus KPR protein.
Preliminary Results
The central objective of our research is to explore the effects of a double mutation of Glu 194 to Arg and Phe 279 to Arg on the stability of the S. aureus KPR’s dimeric structure. In order to induce a double mutation, we performed a mutagenic PCR of Glu 194 to Arg on S. aureus KPR plasmids already containing the Phe 279 to Arg mutation, which we purified from initial E. coli glycerol stock. The mutated plasmids then were transformed into BL21 ultracompetent cells to promote KPR protein production which we then purified to assess the stability of the protein with respect to its structure after the double mutations.
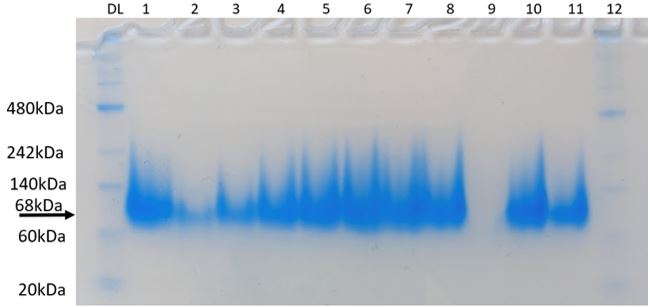
Figure 7: Native-PAGE assay of KPR protein with Phe 279 Arg mutation. 68 kDa corresponds to KPR dimer. Brackets indicate blur corresponding to disrupted dimerization after mutation. Lane PL is our protein ladder. Lanes 1-12 contain our purified KPR proteins. Taken by Dr. Jason O’Donnell for BIOL 3100L.
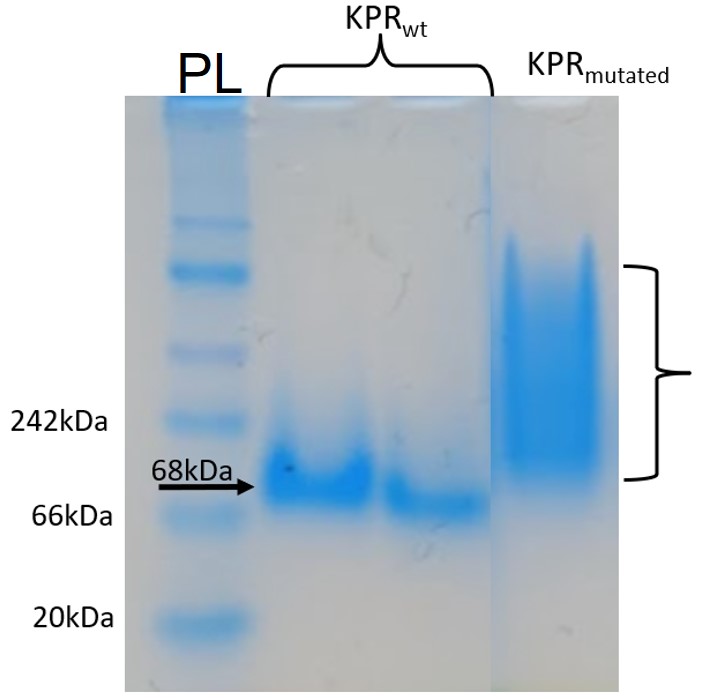
Figure 8: Native-PAGE assay of the Phe 279 Arg KPR protein compared to wildtype KPR. Lane PL contains our protein ladder, and Lanes #2-3 contain the wildtype KPR, and Lane #4 contains the mutated KPR. The arrow points to banding at length 68 kDa corresponding to KPR dimerization. Brackets indicate the aggregation and instability of the mutated KPR as there is no definite banding. Taken by Dr. Jason O’Donnell for BIOL 3100L.
Mutagenic PCR and Verification I
As seen in Figure 4, using the forward and reverse primers chosen, we completed a mutagenic PCR. We then ran an agarose gel electrophoresis to verify successful mutagenesis which confirmed that our KPR plasmid is indeed in our mutagenic PCR product. Using that same mutagenic PCR product, which we now know contains our desired KPR plasmid, we performed a transformation of our plasmids into XL10-Ultracompetent E.coli¸ which saw successful colony formation. After purifying our mutated plasmids from the transformed E. coli cells, we ran a restriction enzyme digest followed by an agarose gel electrophoresis to verify our mutagenic PCR. Since our primers inserted a silent mutation to create an XbaI restriction site, a successful mutagenesis would form two fragments in our plasmids, at around 900 bp and 5300 bp. Since two fragments for our PCR product appeared at the expected lengths, we can conclude that our mutagenic PCR for Phe 279 to Arg was successful since a restriction site at XbaI was inserted. For further verification, we submitted our product for DNA Sanger sequencing which confirmed successful Phe 279 to Arg mutagenesis.
After producing a KPR plasmid with the Phe 279 to Arg mutation, the plasmids were transformed into BL21 E. coli cells in order to produce mutated KPR proteins. After harvesting the proteins and performing induction and purification, a protein gel was performed to separate the proteins to see if our KPR protein was produced. As seen in Figure 7, distinct banding occurs around 68 kDA, which corresponds to the KPR dimer, therefore showing that our purified proteins do indeed correspond to the KPR protein. After dialysis of the proteins, a native-PAGE assay was performed to compare the native conformation of the mutated KPR to the wildtype to study how the Phe 279 to Arg mutation affected the KPR structure and dimer integrity. As shown in Figure 8, the mutated KPR showed no definite banding at 68 kDA like the wildtype KPR, since 68 kDA corresponds to KPR dimerization. We can conclude that the KPR Phe 279 to Arg mutation effectively causes instability and aggregation of the KPR protein dimer as the integrity of the KPR dimer is lost.
Culturing and Purifying Cells and Verification
After letting the LB agar plates incubate for growth, we observed white colony growth, which are colonies containing our desired plasmids since our S. aureus KPR plasmid contained a kanamycin-resistance gene. Unwanted plasmids did not contain this gene, and therefore would not survive to form colonies.
After purifying our plasmid DNA, we ran a gel electrophoresis to verify that our plasmid purification worked correctly and to figure out a rough estimate of our DNA concentration.
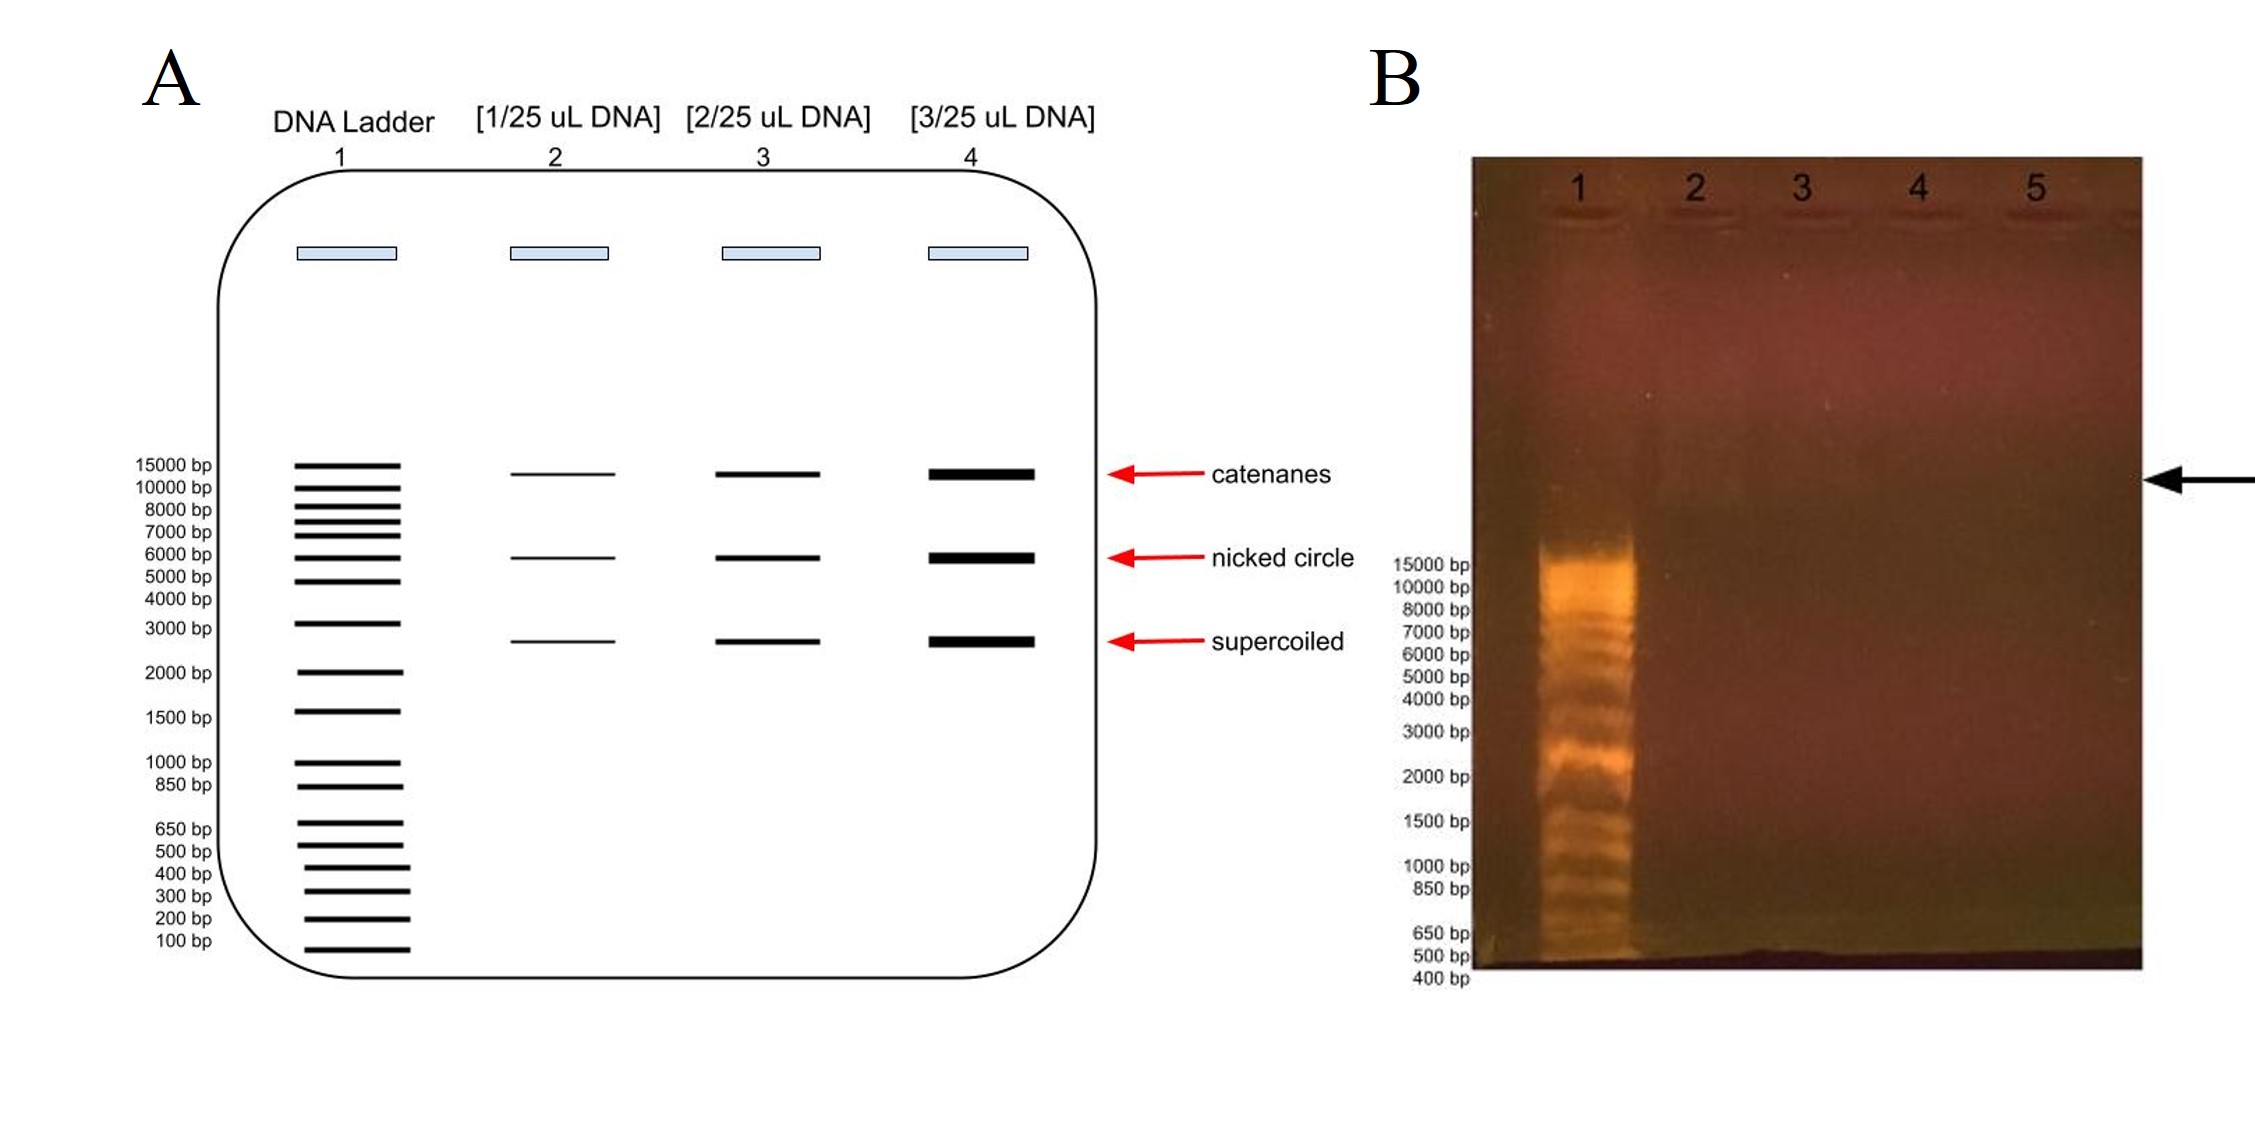
Figure 9: Agarose gel electrophoresis of plasmid DNA at different concentrations compared to the DNA ladder, in lane 1. A) Predicted banding pattern for the purified DNA plasmid at different concentrations, lanes 2-4, compared to the DNA Ladder, lane 1. B) Actual banding patterns of our purified DNA plasmids. The concentrations in lanes 2, 3, 4, and 5 out of 25 uL are 2 uL, 1 uL, 0.5 uL, and 0.2 uL, respectively. The arrow points to the faint banding in lane 2 a little farther up than the 15000 bp label.
In order to estimate the plasmid’s DNA concentration, we ran a gel electrophoresis using different concentrations of DNA to see at which volume the DNA banding was barely visible in the gel. As shown in Figure 9A, we would expect to see more intense banding at higher DNA concentrations, with one banding at around 6000 representing the whole plasmid for the nicked circle, one banding that has traveled faster which is the supercoiled, and another that has traveled slower which would be the catenanes conformation.
As shown in figure 9B, we barely got any banding in lanes 2-5 for our DNA plasmid, although there is some faint banding above 15000 bp in lane 2 at [2 uL/25 uL], although there is even fainter blurring above it and some in lane 3 as well. The faint banding cannot be a result of our agarose gel preparation as the DNA ladder does show up, albeit much farther down as expected. This could be because of letting the gel electrophoresis run too long, which would have been ameliorated if the chosen agarose gel tray had been longer. Perhaps there had been issues with the DNA purification, and it was very dilute and therefore we had very low concentration of DNA, or there had been issues with the DNA plasmid purification for gel electrophoresis.
We did UV-vis spectrometry, from which we calculated the DNA concentration at 29.211 ng/mL. However, due to shortages of purified plasmid, we ended up combining plasmid volumes using the concentration of 125.0 ng/mL instead.
Mutagenic PCR
After running the mutagenic PCR, we ran a gel electrophoresis to verify if our plasmid was properly mutated. As shown in Figure 10, we would expect to see intense banding at around 6000 representing the whole plasmid for the nicked circle, and perhaps some faint blurring banding much farther down the gel due to unhybridized primer sequences.
As shown in Figure 10, there was some blurred but intense banding at around 100 bp in both lanes 2 and 3, which contain the same mutagenic PCR sample. There is no banding at 6000 bp where we would expect the KPR plasmid to be or anywhere else in the lane. The appearance of the primer banding as well as the prominent separation of the DNA ladder shows that the problem doesn’t lie with the agarose gel preparation or gel electrophoresis. Since only the plasmid DNA doesn’t show up in the gel electrophoresis, the issue must be with the mutagenic PCR of the KPR plasmid or purification of the KPR plasmid.
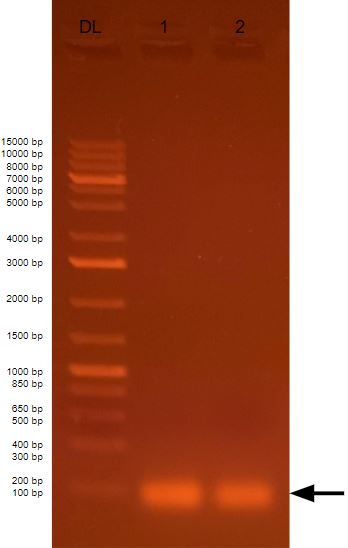
Figure 10: Agarose gel electrophoresis of mutagenic plasmid DNA compared to the DNA ladder, in lane 1. Lanes 2 and 3 contain separate samples of the same 20 uL of mutagenic PCR product. The arrow points to blurred but intense banding around 100 bp. product.
Transformation I
Using the instructor provided PCR product, we performed a transformation of the mutated plasmid into XL-Ultracompetent E. coli cells, which we then cultured onto LB-agar plates supplemented with kanamycin. We saw much growth of white colonies, indicating success.
Mutagenesis Verification
After performing a transformation, we purified the KPR plasmids from the chosen colony for inoculation. Unfortunately, we were not able to run a restriction enzyme digest with NsiI on our own purified KPR plasmids. If we had performed a restriction enzyme with NsiI on a successfully Glu 194 to Arg mutagenized KPR plasmid, we would expect three bandings for the mutated KPR compared to the four bandings for the wildtype in the agarose gel electrophoresis. However, another lab group using the same PCR product for transformation was able to submit their KPR plasmids for DNA sequencing for further verification.
Looking at the DNA Sanger sequencing results of the submitted RQ_OH-T7 plasmid sample, specifically at the Glu 194 to Arg mutation, shown in Figure 11A, we saw an insertion of C at bp 632 and AG at bps 639-640, as intended from our chosen primer pairs. With the C insertion at 632, we do see the removal of the NsiI restriction site as normally present in the wildtype sequence, but we do not see any change in amino acid at that location. At bps 639-640, the AG insertion does change the Glu amino acid as seen in the wildtype to an Arg in the mutated KPR. The sequenced KPR plasmid shows successful mutagenesis at Glu 194 to Arg.
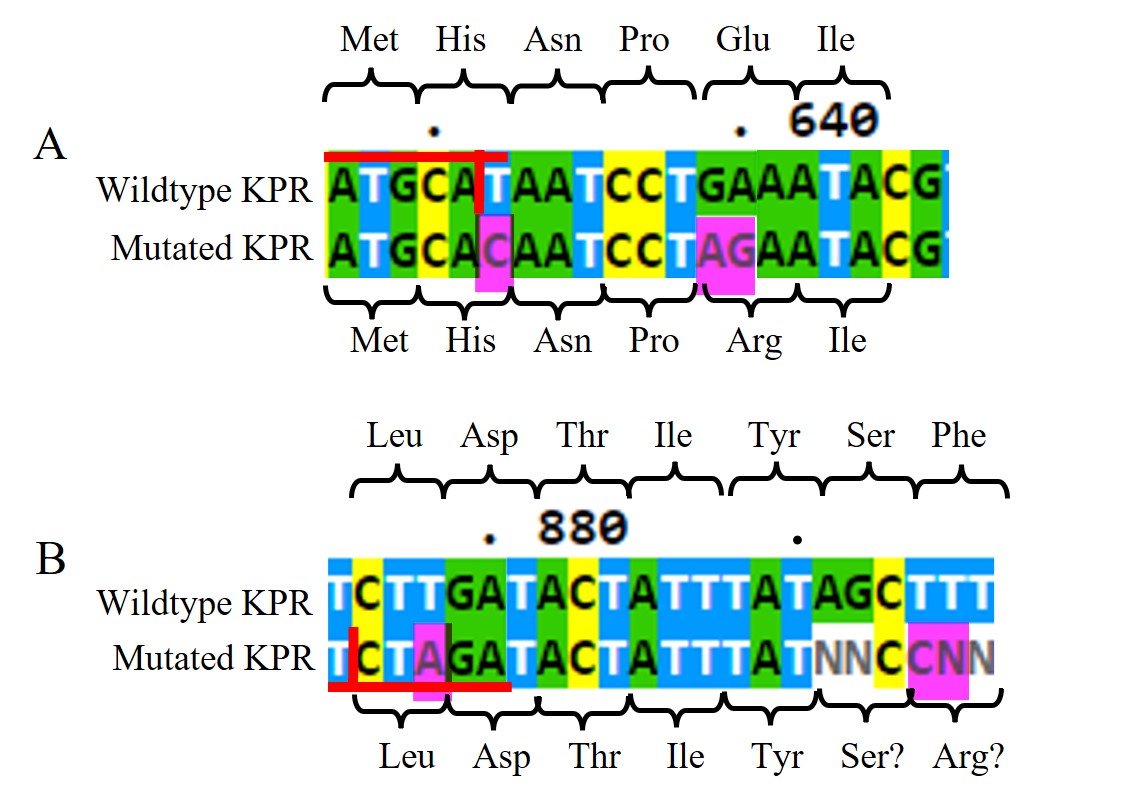
Figure 11: DNA Sanger sequencing results of submitted RQ_OH-T7 plasmid sample. A) DNA sequences of wildtype KPR (top) and the mutated KPR plasmid (bottom) looking at the Glu 194 to Arg mutation. Red horizontal lines highlight the NsiI restriction site with the vertical red line is where it would be cut. The amino acid sequence is labeled. Pink highlights indicate our primer’s inserted mutations. B) DNA sequences of wildtype KPR (top) and the mutated KPR plasmid (bottom) looking at the Phe 279 to Arg mutation. Red horizontal lines highlight the XbaI restriction site with the vertical red line is where it would be cut. The amino acid sequence is labeled. Pink highlights indicate our primer’s inserted mutations. “N” represents any nucleotide in sequence.
Looking at the Phe 279 to Arg mutation, shown in Figure 11B, we saw an insertion of A at bp 878 and C at bp 894, as intended from our chosen primer pairs. At bps 891-892 and 894 and 895, we saw N insertions, and no G insertion at bp 895 as intended. However, N represents any nucleotide so we can assume bp 891-892 are the same nucleotides as found in the wildtype, and the N insertion at bp 895 can be assumed to be the G insertion. With the A insertion at 632, we saw the addition of a XbaI restriction site not normally present in the wildtype sequence, but we do not see any change in amino acid at that location. At bps 894-895, the assumed CG insertion does change the Glu amino acid as seen in the wildtype to a probable Arg in the mutated KPR. The sequenced KPR plasmid suggests a successful mutagenesis at Phe 279 to Arg.
Transformation II
After verifying a double mutation in the KPR plasmids, we transformed the proteins into BL21 E. coli cells for protein production and streak them on LB-agar plates for colony growth to later harvest cells from. Selecting E. coli colony #2, we continued with protein induction followed by protein purification.
Protein Analysis
After purifying the proteins from colony #2, we ran a protein gel to determine if the purified proteins did indeed contain the double mutated KPR protein.
As shown in Figure 12, in Lane #2 which contains the fraction from the column before adding the wash buffer, we saw some faint banding around 35-130 kDa, with some bands appearing slightly more distinct while other bands are more blurred. These protein bands should contain unpurified proteins from the BL21 E. coli colonies that cannot bind to the his-tagged Talon affinity resin in the column, so they flowed out of the column before adding the wash buffer. However, in Lanes #3-6 we saw no signs of banding either of washed-out proteins from the washing fractions or KPR proteins from the elution fractions.
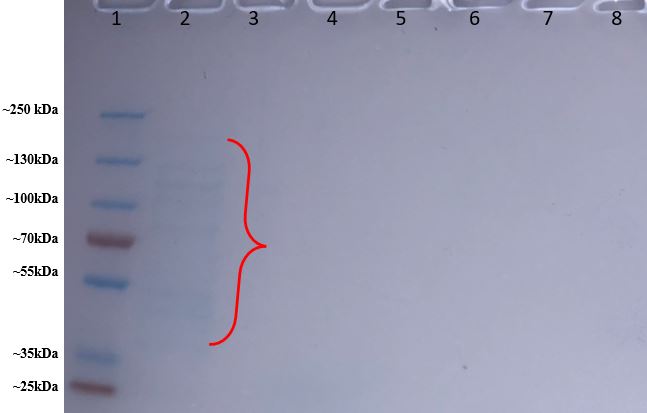
Figure 12: Protein gel results of purified proteins from BL21 E. coli colony #2. Lane #1 contains our protein ladder. Lane #2 contains the fraction before the wash buffer; Lane #3 contains the beginning of the wash fraction and Lane #4 contains the end of the wash fraction. The first elution fraction is in Lane #5, and the second elution fraction is in Lane #6, and the third elution fraction is in lane #7.
Since the protein ladder in the protein gel came out so clearly and separated, and we did see banding in Lane #2, then the issue with our protein gel does not lie with the protein gel itself. There is some banding in Lane #2 which contains proteins that didn’t bind to the column, but there is no banding in the other lanes, which contained fraction samples that would have contained proteins that had been bound to the Talon affinity resin until either washed out or eluted out. This may indicate that the problem may have occurred during protein purification while either washing out and/or eluting the column. However, our issue could either lie with an error in protein purification at a prior step: E. coli colony #2 could have initially not properly been transformed with the mutated KPR plasmid and therefore could not make KPR protein, or the BL21 cells could have not been properly inducted for protein expression and production after transformation.
Conclusion
The goal of our experiment was to change the amino acids glutamate 194, a negatively charged amino acid, and phenylalanine 279, a non-polar amino acid, into arginine, a positively charged amino acid. A change in the characteristic of the amino acid will cause a change in the interactions between the interactions, changing the protein’s structure. A change in protein structure means we can expect a change in protein function as well since function follows structure. Since Glu 194 and Phe 279 are significant amino acids found in the interface of the S. aureus KPR dimer, we can expect a change in the functionality and activity of KPR if Glu 194 and Phe 279 are mutated to Arg. Disruptions in KPR dimerization and thus KPR dysfunctionality can be used as a drug target when developing a drug against S. aureus.
Preliminary results, such as those shown in Figure 8, provided evidence in support of single mutations at Phe 279 to Arg disrupting the integrity of the KPR dimer. Despite the obstacles in performing the mutagenic PCR for Glu 194 to Arg and Phe 279 to Arg on the S. aureus KPR plasmid, our finals results, as illustrated by the protein gel as shown in Figure 12, are inconclusive about the effects of a double mutation on the stability of the KPR dimer since no bandings appeared on the protein gel for the fraction samples of our purified KPR proteins. Therefore, without repeating the protein gel to obtain banding patterns and thus verify our results, we cannot provide evidence to support the prediction that a double mutation at Glu 194 to Arg and Phe 279 to Arg in the S. aureus KPR plasmid will disrupt the dimerization of the S. aureus KPR protein to cause its dysfunction. Further experimentation is needed to support our prediction, which can then be used for future drug development for use in S. aureus infections.
Future Directions
For the future, we hope to continue with our own purified plasmids from the first transformation and perform an NsiI restriction enzyme digest for verification of our mutagenic PCR. From there, we would continue with DNA sequencing for further verification before performing a second transformation to produce KPR proteins for analysis.
For the instructor-provided BL21 E. coli cells containing mutated KPR proteins which we purified and performed a protein gel on, the results were not promising as no banding appeared to indicate KPR protein presence. This may mean we need to repeat the second transformation with BL21 E. coli cell and start the protein induction and purification process over again. We would repeat this until we can get a successful protein gel indicating our mutated KPR protein is present in our protein sample, after which we would follow with dialysis of the KPR protein before performing a protein gel to look at the structure of the S. aureus KPR protein containing a double mutation of Phe 279 to Arg and Glu 194 to Arg. If both mutations disturb the integrity of the KPR dimer, we expect to see banding similar to what is shown in Figure 10 for the mutated KPR. From there, we would continue with other methods of analysis for studying structure and dimerization properties of a KPR protein carrying a double mutation of Glu 194 to Arg and Phe 279 to Arg.
References
- Sanchez, J. E. et al. Evidence of Kinetic Cooperativity in Dimeric Ketopantoate Reductase from Staphylococcus aureus. Biochemistry 54, 3360-3369, doi:10.1021/acs.biochem.5b00174 (2015).
- Taylor, T. A. & Unakal, C. G. Staphylococcus Aureus (StatPearls Publishing, 2021).
- van der Westhuyzen, R. et al. The antibiotic CJ-15,801 is an antimetabolite that hijacks and then inhibits CoA biosynthesis. Chem Biol 19, 559-571, doi:10.1016/j.chembiol.2012.03.013 (2012).
- Leonardi, R., Jackowski, S. & Begley, T. J. Biosynthesis of Pantothenic Acid and Coenzyme A. EcoSal Plus 2, doi:doi:10.1128/ecosalplus.3.6.3.4 (2007).
- Begley, T. P., Kinsland, C. & Strauss, E. The biosynthesis of coenzyme A in bacteria. Vitam Horm 61, 157-171, doi:10.1016/s0083-6729(01)61005-7 (2001).
- Ciulli, A., Chirgadze, D. Y., Smith, A. G., Blundell, T. L. & Abell, C. Crystal structure of Escherichia coli ketopantoate reductase in a ternary complex with NADP+ and pantoate bound: substrate recognition, conformational change, and cooperativity. J Biol Chem 282, 8487-8497, doi:10.1074/jbc.M611171200 (2007).
- Zheng, R. & Blanchard, J. S. Identification of active site residues in E. coli ketopantoate reductase by mutagenesis and chemical rescue. Biochemistry 39, 16244-16251, doi:10.1021/bi002134v (2000).
- Devi, P. B. et al. Structure-guided design of thiazolidine derivatives as Mycobacterium tuberculosis pantothenate synthetase inhibitors. ChemMedChem 9, 2538-2547, doi:10.1002/cmdc.201402171 (2014).
- Arnott, Z. L. P. et al. The Mechanism of Regulation of Pantothenate Biosynthesis by the PanD-PanZ.AcCoA Complex Reveals an Additional Mode of Action for the Antimetabolite N-Pentyl Pantothenamide (N5-Pan). Biochemistry 56, 4931-4939, doi:10.1021/acs.biochem.7b00509 (2017).
- GENEWIZ from Azenta. Sanger Sequencing. https://www.genewiz.com/en/Public/Services/Sanger-Sequencing?sc_device=Mobile.
Acknowledgements: I extend my sincere thanks to Dr. Jason O’Donnell and our GLA Fnu Gurjit Singh for their constant guidance and support during our research even in the face of the many obstacles we encountered in our experiments. I also could not have come so far in this research without the help of my fellow lab group members, Allison Chase, Christie Chow, and Joanna Creason, as well as my classmates in BIOL 3110L. Also, this research could not have come so far without building off the hard work of prior BIOL 3110L classes, whose conclusions where very important in forming the foundations of our research. The plasmid containing the S. aureus KPR gene was kindly gifted to us by Dr. Zachary Wood, Professor in the Department of Biochemistry and Molecular Biology at the University of Georgia.
Citation Style: Nature