Revisiting “Willie” Horton: Assessing the Horton Advertisement’s Impact on the Incarceration of Black People
by Roberto Ortiz
In the Fall of 1988, the criminal record of “Willie” Horton became a centerpiece in the 1988 presidential election following an advertisement released by the National Security PAC detailing his crimes. Although at the time the advertisement was understood as warning of “misguided liberalism,” we now recognize that the advertisement contained implicit racially coded messages that influenced the American public. Specifically, by flashing an image of disgruntled Horton, stereotypic connections between Blackness and criminality were made by the public. Recognizing the effects of implicit racialized primers on our subsequent judgements and actions, I ask the following question: What is the relationship between the Horton advertisement and subsequent incarceration rates of Black people in 1989? To answer this question, I execute a descriptive statistical analysis using statistics provided by the “Sourcebook of Criminal Justice Statistics” to explore the arrest rates of Black people within the United States from 1983-1993 Although I do find a notable increase in percent change from 1988-1989— the year the advertisement was released and the year after— this result becomes less remarkable when situated within the 1983-1993 period. Ultimately, I am unable to determine a prominent relationship between the Horton advertisement and the subsequent arrest rates of Black individuals from 1988-1989. Regardless, these numerical results should not distract from the severity of implicitly coded messages within mass media and their social implications.
‘Willie’ Horton, race, mass media, stereotypes, statistical analysis
In July of 1988, then-governor and Democratic presidential nominee Michael Dukakis of Massachusetts led Vice President and Republican presidential nominee George Bush in the polls by a 58-38 percent margin nationwide (Oliphant 1988). However, come Fall, this quickly changed as the criminal record of William Horton became a centerpiece of the 1988 presidential election: While on a prison furlough, Horton—a Black[1] man convicted of first-degree murder and sentenced to life without parole— escaped a Massachusetts prison. Soon after, Horton kidnapped and assaulted a White couple, repeatedly stabbing Clifford Barnes and raping Barnes’ spouse Angela Miller Barnes (Mendelberg 1997, Schwartzapfel and Keller 2015)[2]. Dukakis, a supporter of the prison furlough program—the very program that released Horton on a weekend pass— was scrutinized immensely in subsequent speeches, presidential debates, and political advertisements.
In particular, an ad ran by the National Security PAC (1988) displayed a disgruntled image of Horton, accompanying a voiceover that read:
One [of the people who received a weekend pass] was Willy Horton, who murdered a boy in a robbery, stabbing him 19 times. Despite a life sentence, Horton received 10 weekend passes. Horton fled, kidnapped a young couple, stabbing the man, and repeatedly raping his girlfriend. Dukakis on crime.
According to journalist Robert MacNeil, the common sentiment among voters was that “I’m going to vote for George Bush because I can’t vote for a man who lets murderers out of jail,” (Jamieson 1992: 33). The resounding opposition against Dukakis is best illustrated in the final results of the presidential election: Bush overcame Dukakis by 53 percent to 46 percent in the popular vote and won 40 out of 50 states (National Archives).
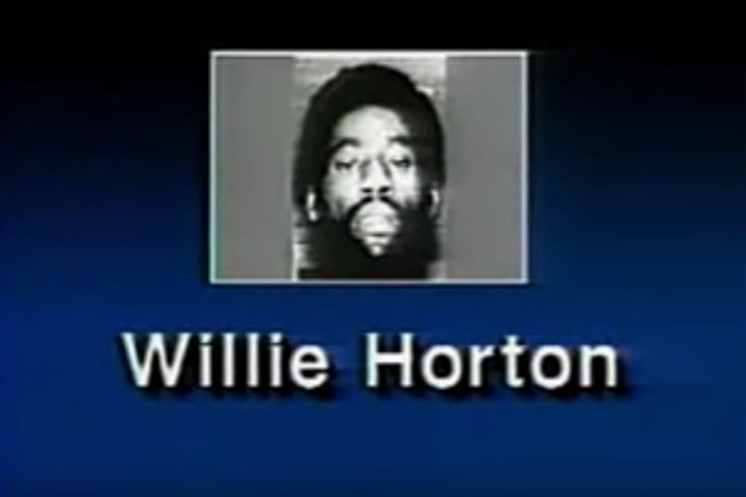
At the time the Horton advertisement was primarily understood as a message about crime, a warning about the dangers of “misguided liberalism” (Mendelberg 1997). However, by flashing an image of disheveled Horton accompanied with a voiceover that describes his crime in detail, the stereotype of the “violent Black male” (Welch 2007) was invoked and reinforced. In an interview conducted by The Nation (Newton 1995: 324),William Horton details the sensitization and racialization of his crime:
The fact is, my name is not ‘Willie’ It’s part of the myth of the case. The name irks me. It was created to play on racial stereotypes: big, ugly, dumb, violent, Black — ‘Willie’. I resent that. They created a fictional character — who seemed believable, but who did not exist. They stripped me of my identity, distorted the facts, and robbed me of my constitutional rights.
In other words, Horton argues that the name “Willie” was fabricated in order to create a specific image of Black men in the public’s imagination, one that is “simpler” and “more violent” in nature. Consequently, through the activation of this racial stereotype, subsequent actions and judgements reflecting the myth of “violent Black man” could be employed to discriminate against Black individuals within social institutions (Dixon 2008, Devine 1989). One prime example of stereotypes influencing subsequent actions can be seen with the ways in which Black people are overpoliced and consequently arrested at much higher rates when compared to other racial groups (Oliver 2003, Robinson 2000). Recognizing that stereotype activation influences subsequent actions, this raises my central research question: What is the relationship between the Horton advertisement and the subsequent incarceration rates of Black people?
In the following paper, I execute a descriptive statistical analysis to explore the arrest rates of Black people within the United States from 1983-1993, five years prior and five years after the release of the Horton advertisement. As suggested by previous research making the connection between implicit racial priming and subsequent discriminatory actions (Robinson 2000, Oliver 2003, Oliver et al. 2002, Dixon 2008, Mendelberg 2001, Devine 1989), I anticipate observing a sharp incline in the arrests of Black men from the period between 1988-1989, reflecting the tangible effects of implicitly coded messages. Overall, I posit that an increasing trend in incarceration would illustrate the power of implicitly coded messages within the media, ultimately functioning as formal social control to simultaneously punish Black men and uphold White supremacy within the United States. This project is significant because the mere identification of implicitly coded racial messages in the media is the first step towards eradicating racialized crime stereotypes within mainstream media, a necessary step in order to form a more equitable and stigma-free society.
Implicit V.S. Explicit Communication: The Effects of Racial Coding
Previous literature has used the theory of cognitive accessibility to suggest that frequent exposure to stereotypes may influence people’s perceptions or influence subsequent judgments (Dixon 2006, Gilliam et al. 2000, Devine 1989). Specifically, Higgins (2000) suggests that accessible stereotypes or overgeneralizations frequently result in social discrimination and hostile actions towards others. Visual media is particularly pervasive in this matter, for it may either implicitly or explicitly reinforces stereotypes and may distort the viewer’s sense of reality (Jamieson 1992, Baudrillard and Glaser 1994).
Notably, mainstream mass media, particularly the news and reality entertainment, is oversaturated with television programming that explicitly portrays Black men as dangerous “villains,” White men as “heroes,” and the police as a necessary force to “restore justice” (Oliver 2003: 7-8). These archetypes ultimately position Black men as a “social threat” to society (Jackson 1997) that must be “policed and controlled.” Therefore, under the guise of “entertainment,” the inaccurate representation of Black men translates into the false perception that Black people are inherently violent criminals (Dixon 2008).
In stark contrast, the 1988 Horton advertisement appealed to race in an implicit manner; it never once mentioned race. Although there was no verbal mention of race within the Horton advertisement, visual cues to racial stereotypes were employed to activate the stereotype of the “violent Black male” in the public’s imagination (Oliver 2003, Welch 2007). In this particular case, Horton was displayed as disgruntled and intimidating in one shot, while shown handcuffed by a police officer in another (National Security PAC 1988):

As pointed out by Mendelberg (2001), visual images are an extremely effective way to communicate implicitly and have a prominent role in creating and perpetuating racial stereotypes (Hurwitz and Peffley 1997). Specifically, exposure to racial stereotypes may lead to implicit stereotype activation (Higgins 2000, Fiske and Taylor 1991, and Devine 1989), resulting in a heightened probability that any Black man be perceived or treated as a criminal purely based on preconceived stereotypes between race and crime (Oliver and Fonash 2002).
The effects of creating a false narrative between race and crime, particularly treating Blackness as a sign for increased criminality, can be best seen in the overrepresentation of Black people in the criminal justice system (Robinson 2000, Kennedy 1997). Because police use unchecked discretion to make decisions, racial stereotypes and biases often infiltrate police work (Cole 1999). Specifically, discrepancies occur most when police use race as a risk factor—those who are “young, Black, and male equal probable cause” (Gaynes, 1993:621). In summation, Robinson (2000) asserts that “because of deeply entrenched myths… reinforced by …. media coverage, the American system of criminal justice has engaged in a new form of racial segregation: punishment,” (151). In other words, the criminal justice system has evolved to maintain control over those outside of the hegemonic group— Black men.
Recognizing the media’s role in creating and reinforcing the stereotype of inherent Black criminality and the impact stereotypes have on subsequent judgements and actions (Robinson 2000, Oliver 2003, Oliver et al. 2002, Dixon 2008, Mendelberg 2001), I ask the central question: What is the relationship between the Horton advertisement and the subsequent incarceration rates of Black people?
Method
To determine the relationship between the Horton advertisement and its impact on the arrest rates of Black individuals, I execute a descriptive statistical analysis using statistics from the years 1983-1993— five years prior and five years after the release of the Horton advertisement. All of the statistics I use are obtained from the “Sourcebook of Criminal Justice Statistics”: an annual compilation of reviewed criminal justice statistical information from thousands of federal, state, and local agencies, including academic institutions, research organizations, and public opinion polling firms (Jamieson and Flanagan 1984-1994). The purpose of the sourcebook is to centralize crime data and criminal justice statistics within the United States. Since 1973, this project has been sponsored by the Bureau of Justice and remains based at in the Hindelang Criminal Justice Research Center in Albany, New York (Jamieson and Flanagan 1984-1994).
Each edition of the “Sourcebook of Criminal Justice Statistics” includes six different sections: section one includes characteristics of the criminal justice systems; section two illustrates public attitudes toward crime and criminal justice-related topics; section three highlights the nature and distribution of known offenses; section four outlines the characteristics and distribution of persons arrested; section five describes the judicial processing of defendants, and section six displays the persons under correctional supervision (Jamieson and Flanagan 1984-1994). I obtained all statistics for this study from Section Four: Characteristics and Distribution of Persons Arrested, specifically from Table 4.8 in the 1984, 1985, 1986, 1987 edition, Table 4.9 in the 1988, 1989, 1990, 1991 edition, and Table 4.11 in the 1989 edition of the sourcebook, which display data by offense charged, age group, and race within the United States (Jamieson and Flanagan 1984-1994). All of the editions of the sourcebook were edited by Timothy J. Flanagan and Katherine M. Jamieson.
In order to conduct my analysis, I centralize the statistics obtained from Section Four: Characteristics and Distribution of Persons Arrested from the 1983-1993 editions Sourcebook in Table 1 to visualize and compare the statistics numerically to one another across racial groups. Next, in an effort to standardize the data to be able to make true comparisons across racial groups and across years, I convert all of the arrest rates from Table 1 into percentages shown on Table 2. Subsequently, I convert Table 1 into a line graph with markers (Figure 1), placing years on the x axis and number of people arrested on the y axis in order to better illustrate change over time and across racial groups. For Table 1, I assigned White people to the blue line, Black people to the orange line, American Indian or Alaskan Native people to the grey line, and Asian or Pacific Islander people to the yellow line. Due to the large spread presented in Figure 1, I construct Figure 2 using a logarithmic base for the y-axis (the number of arrests) to illustrate the points for all racial groups more clearly. To visualize change in total arrests from 1983-1993, I design Figure 3, a line graph with markers. Most significantly, to determine the relationship between the 1988 Horton advertisement and the incarceration of Black people, I construct Table 3 in which I calculate the rate of change and percent change across all racial groups from 1988-1989.
Results
Table 1. Arrests in the United States by Race from 1983-1993
| 1983 | 1984 | 1985 | 1986 | 1987 | 1988 | 1989 | 1990 | 1991 | 1992 | 1993 | |
|---|---|---|---|---|---|---|---|---|---|---|---|
| White | 7,291,129 | 6,528,686 | 7,337,681 | 7,370,777 | 7,386,639 | 6,903,070 | 7,559,138 | 7,712,339 | 7,251,862 | 8,030,171 | 7,855,287 |
| Black | 2,796,038 | 2,216,299 | 2,721,144 | 2,788,934 | 3,168,129 | 2,977,266 | 3,459,177 | 3,224,060 | 3,049,299 | 3,598,259 | 3,647,174 |
| American Indian or Alaskan Native | 93,736 | 89,873 | 111,459 | 106,926 | 116,916 | 105,050 | 113,777 | 122,586 | 115,345 | 130,770 | 126,017 |
| Asian or Pacific Islander | 66,956 | 55,804 | 69,194 | 69,305 | 78,625 | 82,061 | 92,436 | 92,383 | 99,893 | 117,004 | 113,273 |
| Total | 10,247,859 | 8,890,662 | 10,239,478 | 10,335,942 | 10,750,309 | 10,067,447 | 11,224,528 | 11,151,368 | 10,516,399 | 11,876,204 | 11,741,751 |
Table 2. Arrests in the United States by Race from 1983-1993 (in percentages)
| 1983 | 1984 | 1985 | 1986 | 1987 | 1988 | 1989 | 1990 | 1991 | 1992 | 1993 | |
|---|---|---|---|---|---|---|---|---|---|---|---|
| White | 71.1% | 73.4% | 71.7% | 71.3% | 68.7% | 68.6% | 67.3% | 69.2% | 69.0% | 67.6% | 66.9% |
| Black | 27.3% | 24.9% | 26.6% | 27.0% | 29.9% | 29.6% | 30.8% | 28.9% | 29.0% | 30.3% | 31.1% |
| American Indian or Alaskan Native | 0.9% | 1.0% | 1.1% | 1.0% | 1.1% | 1.0% | 1.0% | 1.1% | 1.1% | 1.1% | 1.1% |
| Asian or Pacific Islander | 0.7% | 0.6% | 0.7% | 0.7% | 0.7% | 0.8% | 0.8% | 0.8% | 0.9% | 1.0% | 1.0% |
| Total | 100% | 100% | 100% | 100% | 100% | 100% | 100% | 100% | 100% | 100% | 100% |
Note: The data for Table 1 and Table 2 was obtained from Section Four: Characteristics and Distribution of Persons Arrested, specifically from Table 4.8 in the 1984, 1985, 1986, 1987 edition, Table 4.9 in the 1988, 1989, 1990, 1991 edition, and Table 4.11 in the 1989 edition of the “Sourcebook of Criminal Justice Statistics,” which display data by offense charged, age group, and race within the United States (Jamieson and Flanagan 1984-1994).
Table 1 presents statistics of the number of arrests made within the United States by race from 1983-1993, as well as the total number of arrests within this period. In order to standardize the data for the purpose of comparing across racial groups and years, Table 2 displays the percentages of the data from Table 1. Based on Table 2, as the percentage of incarcerated White people decreases, the number of incarcerated Black people increases. For instance, from 1986-1987, as the percentage of White people who make up the total number of incarcerated individuals decreases from 71.3% to 68.7%, the number of incarcerated Black people from 1986-1987 increases from 27% to 29.9%. This trend is notable for it seems there is an inverse relationship between the Black and White racial groups: as the incarceration rates of one group increases, the incarceration rate decreases in the other group.
Figure 1. Arrests in the United States by Race from 1983-1993

Figure 2. Arrests in the United States by Race from 1983-1993 (Log 10)
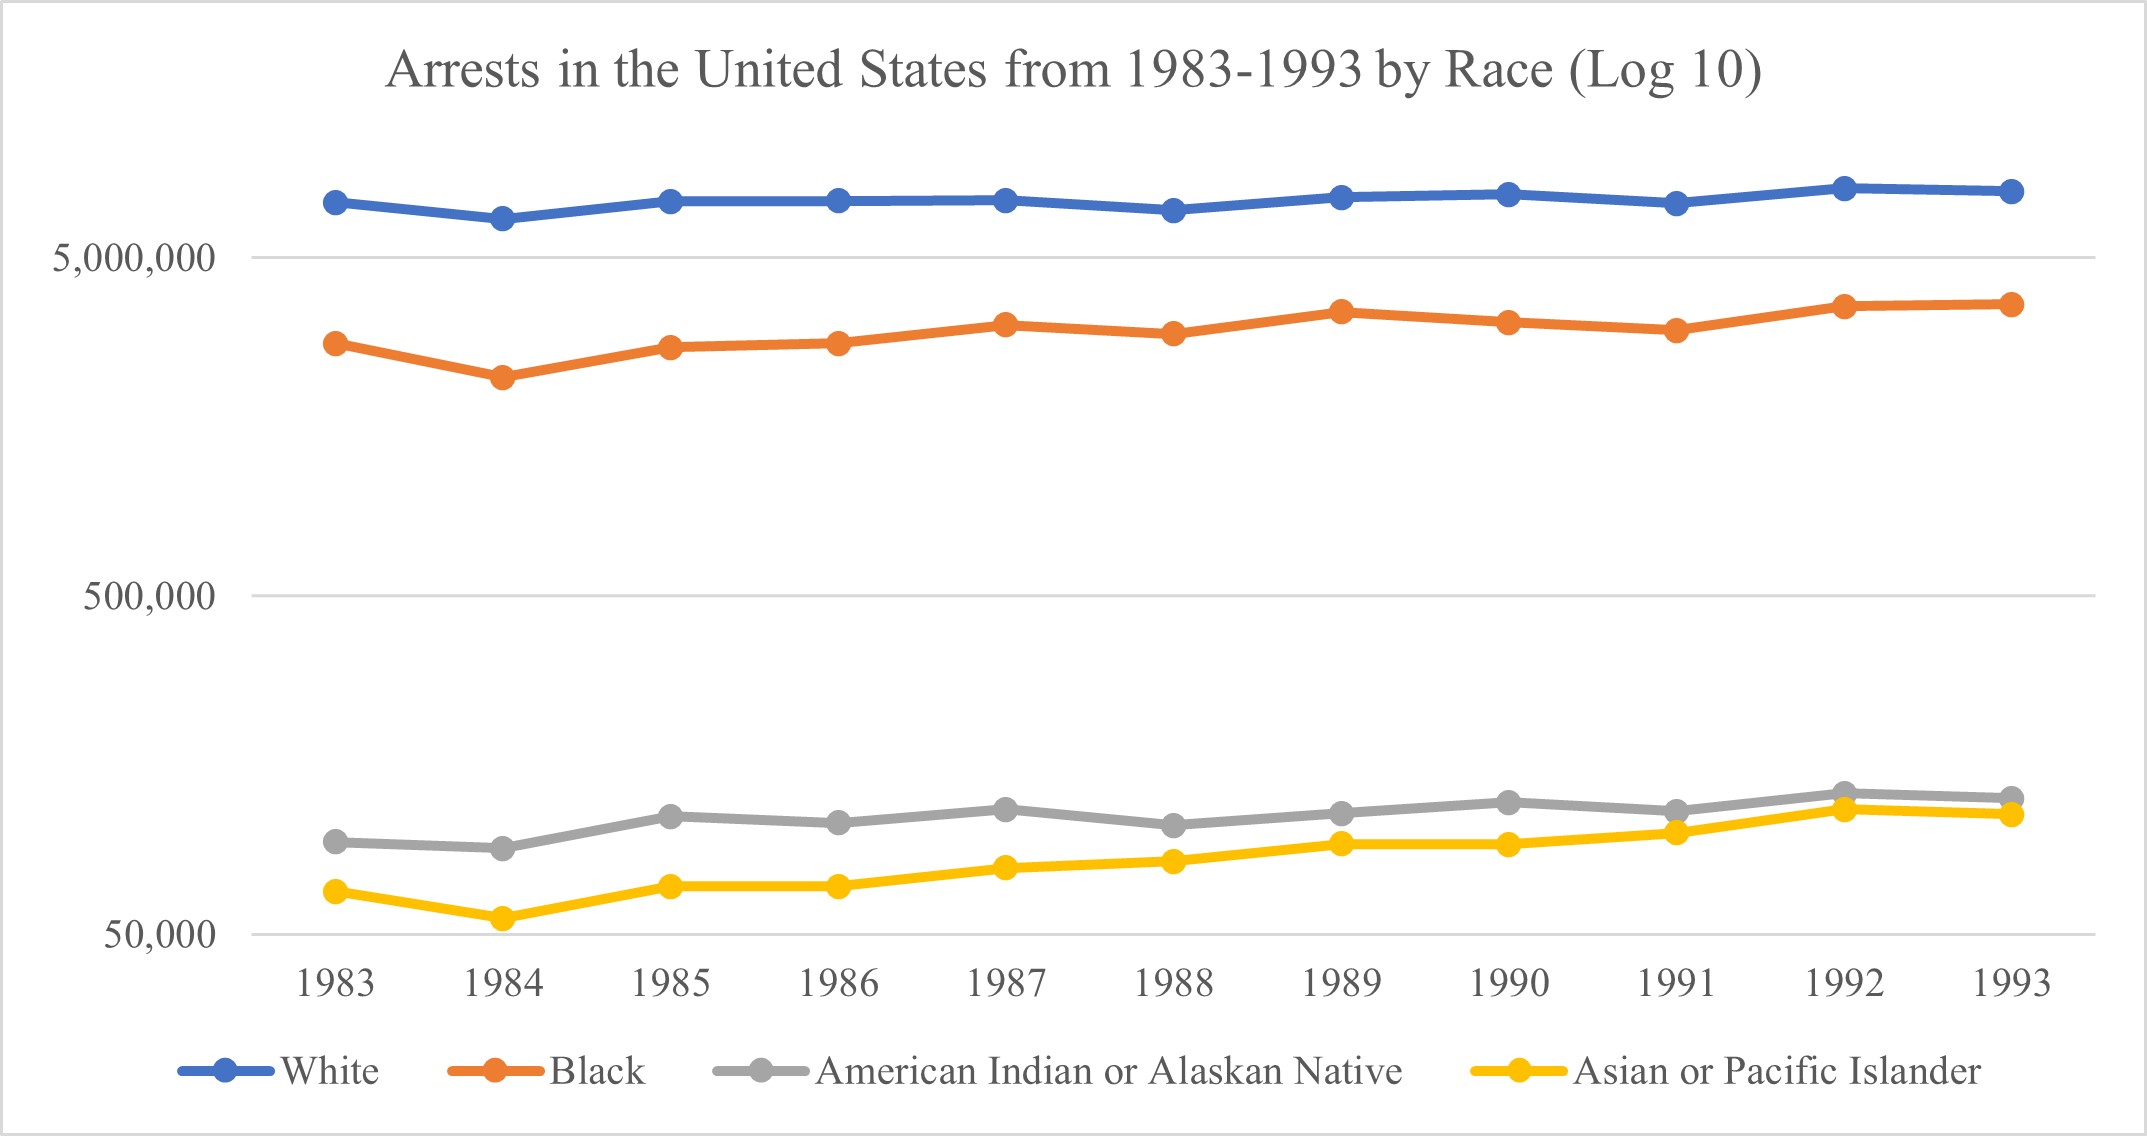
Note. The data for Figure 1 and Figure 2 are obtained from Section Four: Characteristics and Distribution of Persons Arrested, specifically from Table 4.8 in the 1984, 1985, 1986, 1987 edition, Table 4.9 in the 1988, 1989, 1990, 1991 edition, and Table 4.11 in the 1989 edition of the “Sourcebook of Criminal Justice Statistics”, which display data by offense charged, age group, and race within the United States (Jamieson and Flanagan 1984-1994).
Figure 1 presents the data displayed in Table 1 in a line graph with markers to best illustrate trends over time. Due to the large spread presented in Figure 1, Figure 2 uses a logarithmic base for the y-axis (the number of arrests) to better see the differences between the arrests in the American Indian or Alaskan Native and Asian or Pacific Islander groups. Notably, the inverse relationship between the Black and White racial group is not as prominent in either Figure 1 or Figure 2. In these two figures, the trends among Black and White individuals seem to mirror each other; in Figure 1, the Black and White racial groups roughly increase and decrease together. Additionally, as illustrated by Figure 2, the number of Black and White individuals arrested increased between 1984-1985, 1988-1989, and 1991-1992.
Figure 3. Total Arrests within the United States from 1986-1991
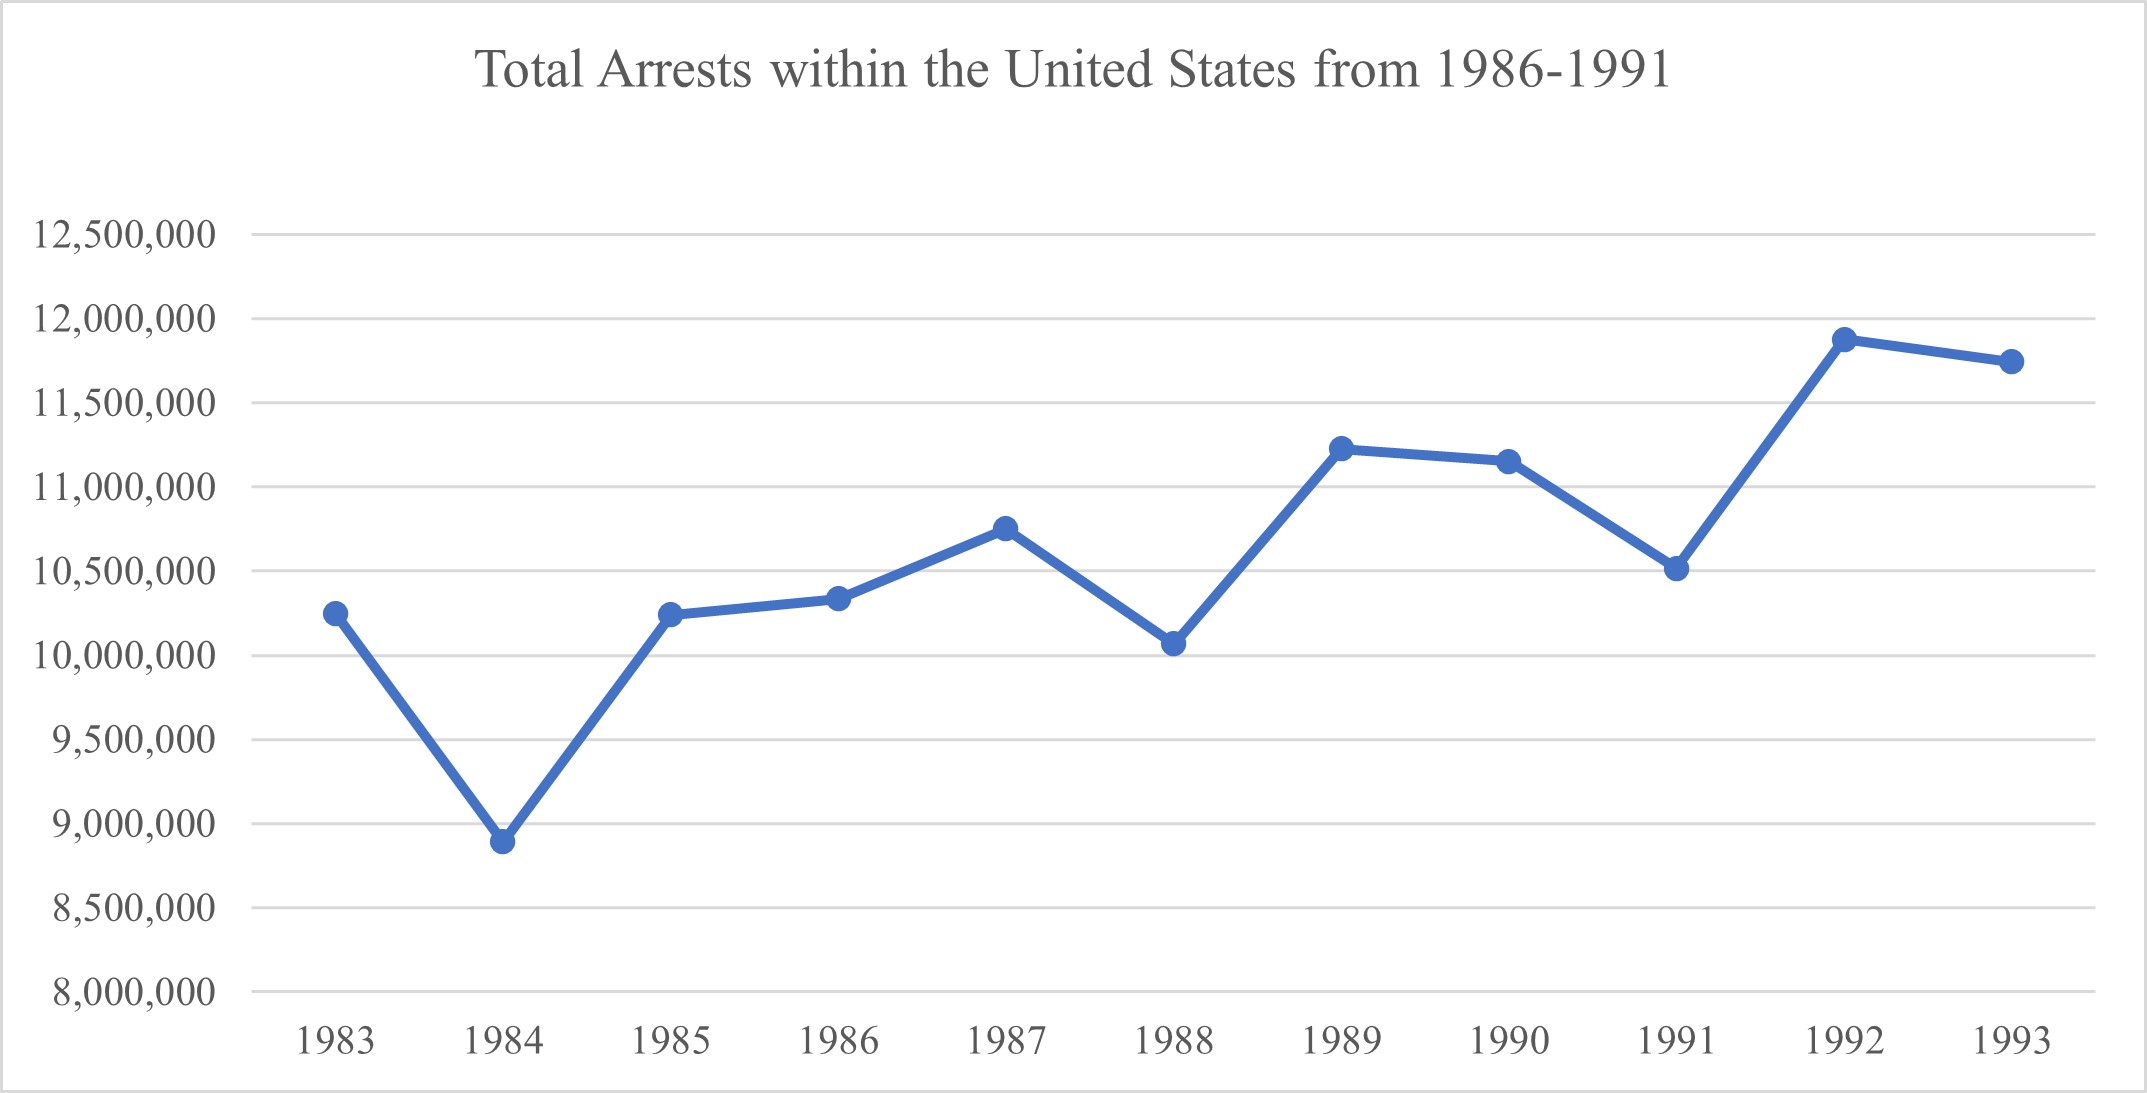
Note: The data for Figure 3 was obtained from Section Four: Characteristics and Distribution of Persons Arrested, specifically from Table 4.8 in the 1984, 1985, 1986, 1987 edition, Table 4.9 in the 1988, 1989, 1990, 1991 edition, and Table 4.11 in the 1989 edition of the “Sourcebook of Criminal Justice Statistics,” which display data by offense charged, age group, and race within the United States (Jamieson and Flanagan 1984-1994).
Figure 3 presents the total arrests made within the United States from 1983-1993 in a line graph with markers. Most interestingly, Figure 3 displays the immense variation between the years 1983-1985, 1987-1989, and 1990-1992. Notably, for the first two ranges, the arrest rate decreases the year before a presidential election (1983, 1987) and increases the year after a presidential election (1985, 1989). Overall, Figure 3 demonstrates a steady increase in incarceration rates among individuals of all racial groups over a ten year period.
To determine whether there is a meaningful relationship between the 1988 Horton advertisement and subsequent arrests in the year 1989, I design Figure 3 in which I calculate the rate of change and percent change across all racial groups.
Table 3. Rate of Change from 1988-1989 Divided by Race
| 1988 | 1989 | Rate of Change | Percent Change | |
|---|---|---|---|---|
| White | 6,903,070 | 7,559,138 | +656,068 | 9.5% |
| Black | 2,977,266 | 3,459,177 | +481,911 | 16.2% |
| American Indian or Alaskan Native | 105,050 | 113,777 | +8,727 | 8.3% |
| Asian or Pacific Islander | 82,061 | 92,436 | +10,375 | 12.6% |
| Total | 10,067,447 | 11,224,528 | +1,157,081 | 11.5% |
As demonstrated by Table 3, Black individuals faced the largest increase in arrests from 1988 to 1989, with a 16.2% increase in arrests compared to the 9.5% of increase in arrests among White people. One could attribute this notable increase in percent change to the Horton advertisement, which may have implicitly invoked and reinforced the stereotype between Blackness and criminality.
The Relationship between the Horton Advertisement and the Subsequent Arrests of Black People
Recognizing the prominence of racial profiling based off stereotypes in police work (Cole 1999), as well as the impact exposure to stereotypes have on subsequent judgements (Dixon 2006, Gilliam et al. 2000), the Horton advertisement may have, in some capacity, aided in the implicit construction of Blackness as a compelling “social threat” to Whiteness (Jackson 1997), leading to subsequent over policing and incarceration of Black people. This argument is supported by solely citing Table 3: the incarceration rate of Black people increased by 16.2% from the year 1988, the year the advertisement was released, and 1989 for a total increase of 481,911 arrests.
However, when the 16.2 percent increase in the incarceration of Black people is assessed in context from 1983-1993, a more nuanced conclusion is reached— there was a 22.9 percent increase in the incarceration of Black individuals from 1984-1985. Thus, the 16.2 percent increase discovered from the years 1988-1989 happens to not be as remarkable as initially perceived when placed in a 10 year context. Ultimately, based on this data, it is unlikely that the Horton advertisement had a notable impact on the subsequent incarceration rates of Black people.
Regardless, these numerical results should not distract from the severity of implicitly coded messages within mass media and their social implications, particularly the social impact of the Horton advertisement. Horton’s role in election is undeniable, for it confirmed the public’s stereotypical perceptions regarding inherent Black criminality. For instance, according to Mendelberg (2001) many years after the election, voters were asked what they remembered from the 1988 election. They tended to provide three names: Dukakis, Bush, and Horton. Additionally, as noted by Chaffee and German (1998, 311), the narratives that politicians create in the media may function to “socialize the entire population, mainstream and minority, young and old by the way they depict and discuss minorities.” Thus, at the very least, the Horton advertisement may have aided in the construction Blackness as a compelling “social threat” to Whiteness in the years following the advertisement (Jackson 1997).
Limitations
It is important to note that there are a number of limitations to this study. The data provided by Sourcebook of Criminal Justice Statistics does not provide arrest rates by gender (Jamieson and Flanagan 1984-1994). As pointed out by Crenshaw (1989), due to the unique positionality provided by a coalescence of both race and gender, an analysis without the use of an intersectional framework is incomplete. Additionally, because the myth of inherent Black criminality is often tied with men (Oliver 2003, Welch 2007), this project would have benefited by analyzing the percent increase in arrest rates from 1988-1989 by gender. Future research should attempt to reconstruct my line of inquiry with data separated by gender.
Additionally, as previously noted, the largest percent increase occurs from 1984-1995, consequently making the percent increase from 1988-1989 unremarkable. However, future research should supply statistical data with archival qualitative data to obtain a more nuanced perspective at the ways in which people perceived and interpreted the Horton advertisement in 1988 and 1989. Only then could a much more solid conclusion on the relationship between the Horton advertisement and the incarceration rates of Black people be reached.
Conclusion
Through the execution of a descriptive statistical analysis, I was unable to determine a prominent relationship between the Horton advertisement and arrest rates of Black individuals from 1988-1989. Although there was a 16.2% increase (+481,911 arrests) among Black individuals between the years 1988 and 1989, this percent increase loses its value when placed in context— there was a 22.9% increase in the incarceration of Black individuals from 1984-1985, ultimately making the 16.2% increase between the years 1988 and 1989 unremarkable.
Regardless, it is still essential to note that the Horton advertisement had tangible social implications on the American population, for it became a centerpiece of the 1988 election because of the way it implicitly activated the stereotype of the inherent Black criminal in the public’s imagination. Importantly, the implications of the Horton advertisement were salient to William Horton himself, as he points out in an interview conducted by The Nation (Newton 1995: 324), the media changed his name, distorted the facts, and created a fictional character for the purpose of highlighting racial stereotypes. Thus, despite not finding strong evidence to determine a relationship between the Horton advertisement and the subsequent incarceration rates of Black people, it is necessary to acknowledge that the media has and will continue to have significant effects on socializing society into believing prejudice attitudes. Therefore, it is necessary to actively work towards eliminating racialized stereotypes within mainstream media for the purpose of forming a more equitable and stigma-free society.
Works Cited
Baudrillard, Jean, and Sheila Glaser. 1994. Simulacra and Simulation. University of Michigan Press.
Cole, David. 1999. No equal justice: Race and class in the American criminal justice system. New York: New Press.
Chaffee, Rebecca, and Daniel B. German. 1998. “New Frontiers in Political Socialization Research: Media and racial minorities in the USA.” Sozialwissenschaftliche und bildungstheoretische: Reflexionen, 312–320.
Crenshaw, Kimberle. 1989. “Demarginalizing the Intersection of Race and Sex: A Black Feminist Critique of Antidiscrimination Doctrine, Feminist Theory and Antiracist Politics.” University of Chicago Legal Forum, 1989: 139-168.
Devine, Patricia G. 1989. “Stereotypes and prejudice: Their automatic and controlled components.” Journal of Personality and Social Psychology, 56: 5–18.
Dixon, Travis L. 2006. “Psychological reactions to crime news portrayals of Black criminals: Understanding the moderating roles of prior news viewing and stereotype endorsement.” Communication Monographs, 73: 162–187.
Dixon, Travis L. 2008. “Crime News and Racialized Beliefs: Understanding the Relationship between Local News Viewing and Perceptions of African Americans and Crime.” Journal of Communication, 58(1): 106-125. doi:10.1111/j.1460-2466.2007.00376.x
Fiske, Susan T., and Taylor, Shelley E. 1991. Social cognition. New York: McGraw‐Hill.
Flanagan Timothy J., and Katherine M. Jamieson, eds. 1984. “Sourcebook of Criminal Justice Statistics: 1983.” U.S. Department of Justice, Bureau of Justice Statistics. Washington, DC: USCPO. Table 4.8. Available: (https://www.bjs.gov/content/pub/pdf/scjs83.pdf)
Flanagan Timothy J., and Katherine M. Jamieson, eds. 1986. “Sourcebook of Criminal Justice Statistics: 1985.” U.S. Department of Justice, Bureau of Justice Statistics. Washington, DC: USCPO. Table 4.8. Available: (https://www.bjs.gov/content/pub/pdf/scjs85.pdf)
Flanagan Timothy J., and Katherine M. Jamieson, eds. 1988. “Sourcebook of Criminal Justice Statistics: 1987.” U.S. Department of Justice, Bureau of Justice Statistics. Washington, DC: USCPO. Table 4.8. Available: (https://www.bjs.gov/content/pub/pdf/scjs87.pdf)
Flanagan, Timothy J., and Katherine M. Jamieson, eds. 1990. “Sourcebook of Criminal Justice Statistics: 1989.” U.S. Department of Justice, Bureau of Justice Statistics. Washington, DC: USGPO. Table 4.9. Available: (https://www.bjs.gov/content/pub/pdf/scjs89.pdf)
Flanagan, Timothy J., and Kathleen M. Jamieson, eds. 1992. “Sourcebook of Criminal Justice Statistics: 1991.” U.S. Department of Justice, Bureau of Justice Statistics. Washington, DC: USGPO. Table 4.9. Available: (https://www.bjs.gov/content/pub/pdf/scjs91.pdf)
Flanagan, Timothy J., and Kathleen M. Jamieson, eds. 1994. “Sourcebook of Criminal Justice Statistics: 1993.” U.S. Department of Justice, Bureau of Justice Statistics. Washington, DC: USGPO. Table 4.11. Available: (https://www.bjs.gov/content/pub/pdf/scjs93.pdf)
Gaynes, Elizabeth A. 1993. “The urban criminal justice system: Where young + Black + male = probable cause.” Fordham Urban Law Journal, 20: 621.
Gilliam, Franklin D., and Shanto Iyengar. 2000. “Prime suspects: The influence of local television news on the viewing public.” American Journal of Political Science, 44(3): 560–573.
Higgins, Edward T. 2000. “Social cognition: Learning about what matters in the social world.” European Journal of Social Psychology, 30: 3–39.
Hurwitz, Jon, and Mark Peffley. 1997. “Public Perceptions of Race and Crime: The Role of Racial Stereotypes.” American Journal of Political Science 41(2): 375-401. doi:10.2307/2111769.
Jackson, Pamela. 1997. Minority group threat, crime and policing: Social context and social control. New York: Praeger.
Jamieson, Kathleen Hall. 1992. Dirty Politics. Oxford: Oxford University Press.
Jamieson, Katherine M., and Timothy J. Flanagan, eds. 1987. “Sourcebook of Criminal Justice Statistics: 1986.” U.S. Department of Justice, Bureau of Justice Statistics. Washington, DC: USCPO. Table 4.8. Available: (https://babel.hathitrust.org/cgi/pt?id=osu.32437000507638&view=1up&seq=326&q1=4.12)
Jamieson, Katherine M., and Timothy J. Flanagan, eds. 1989. “Sourcebook of Criminal Justice Statistics: 1988.” U.S. Department of Justice, Bureau of Justice Statistics. Washington, DC: USCPO. Table 4.9. Available: (https://www.bjs.gov/content/pub/pdf/scjs88.pdf)
Jamieson, Katherine M., and Timothy J. Flanagan, eds. 1991. “Sourcebook of Criminal Justice Statistics: 1990.” U.S. Department of Justice, Bureau of Justice Statistics. Washington, DC: USGPO. Table 4.9. Available: (https://www.bjs.gov/content/pub/pdf/scjs90.pdf
Jamieson, Katherine M., and Timothy J. Flanagan, eds. 1993. “Sourcebook of Criminal Justice Statistics: 1992.” U.S. Department of Justice, Bureau of Justice Statistics. Washington, DC: USGPO. Table 4.9. Available: (https://www.bjs.gov/content/pub/pdf/scjs92.pdf).
Kennedy, Randall. 1997. Race, Crime and the Law. New York: Vintage.
Mendelberg, Tali. 1997. “Executing Hortons: Racial Crime in the 1988 Presidential Campaign.” The Public Opinion Quarterly, 61(1): 134-157. http://www.jstor.org/stable/2749515.
Mendelberg, Tali. 2001. The Race Card: Campaign Strategy, Implicit Messages, and the Norm of Equality. Oxford: Princeton University Press. doi:10.2307/j.ctt1trkhws
National Archives. 1988 Electoral College Results. (https://www.archives.gov/electoral-college/1988)
National Security PAC. September 21, 1988. “Willie Horton 1988 Attack Ad.” YouTube. Retrieved March 25, 2021 (https://www.youtube.com/watch?v=Io9KMSSEZ0Y)
National Security PAC. September 21, 1988. “Mugshot of William Horton.” From YouTube. Retrieved March 25, 2021 (https://www.youtube.com/watch?v=Io9KMSSEZ0Y)
National Security PAC. September 21, 1988. “Photo of William Horton being Handcuffed.” From YouTube. Retrieved March 25, 2021 (https://www.youtube.com/watch?v=Io9KMSSEZ0Y)
Newton, Adam Zachary. 1995. Narrative Ethics. Harvard: Harvard University Press.
Oliphant, Thomas. 1988. “Dukakis gets Bounce from Convention.” The Boston Globe (Boston, Massachusetts), July 26, 12.
Oliver, MaryBeth. 2003. “African American Men as ‘Criminal and Dangerous’: Implications of Media Portrayals of Crime on the ‘Criminalization’ of African American Men.” Journal of African American Studies, 7(2): 3-18. http://www.jstor.org/stable/41819017.
Oliver, MaryBeth, and Dana Fonash. 2002. “Race and crime in the news: Whites’ identification and misidentification of violent and nonviolent criminal suspects.” Media Psychology, 4: 137-156.
Robinson, Matthew. 2000. “The Construction and Reinforcement of Myths of Race and Crime.” Journal of Contemporary Criminal Justice, 16(2):133–56. https://doi.org/10.1177/1043986200016002002.
Schwartzapfel, Beth, and Bill Keller. 2015. “Willie Horton Revisited.” Retrieved September 23, 2021. (https://www.themarshallproject.org/2015/05/13/willie-horton-revisited)
Tunnell, Kenneth. 1992. “Film at eleven: Recent developments in the commodification of crime.” Sociological Spectrum, 12(3): 293-313. DOI: 10.1080/02732173.1992.9982002
Wachal, Robert. 2000. “The Capitalization of Black and Native American.” American Speech, 75(4): 364-365. https://www.muse.jhu.edu/article/2793.
Wang, Jackie. 2017. Carceral capitalism. Brooklyn: Semiotext(e).
Welch, Kelly. 2007. “Black Criminal Stereotypes and Racial Profiling.” Journal of Contemporary Criminal Justice, 23(3): 276–288. https://doi.org/10.1177/1043986207306870
Notes
[1] Although not consistent with ASA guidelines, I capitalize both “Black” and “White” in order to honor the weight of racial identity appropriately (Wachal 2000).
[2] It is important to note that neither Mendelberg (1997) nor the Horton advertisement itself (National Security PAC 1988) mention the names of Clifford Barnes and Angela Miller Barnes, Horton’s two victims (Schwartzapfel and Keller 2015). Placing all of the attention on the criminal instead of the victims functions to create and reinforce the trope of the “Black criminal” in the public’s imagination.
Acknowledgements: I would first like to show my appreciation to my assigned Readers and the Journal Editor for their valuable comments and suggestions. Additionally, I’d like to thank Dr. Richard Blissett for helping me tease out the methodology for this project and Mr. Jeff Patterson for providing me with invaluable feedback and assisting me with this project every step of the way!
Citation Style: ASA